Building slim Docker images for Python with multi-stage builds

It seems like these days everyone has their own bespoke recommended method for Dockerizing Python applications. These include several base images for doing data science in Python. Some people advocate for the usage of alpine-based images, others criticize alpine's lack of support for the types of workloads commonly used for data analysis in Python. Many people bring up Docker's support for multi-stage builds as a way to keep Docker images small, but in what contexts are multi-stage builds effective? Is there a simple, generic way to use them without getting into a long discussion on how to optimize Dockerfiles? This post will discuss all these issues - and more!
Read more…

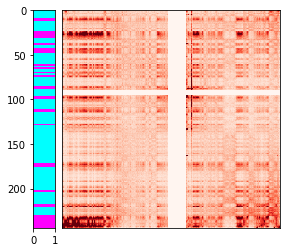
Identifying compartments in Hi-C data

Long-range chromatin contact patterns reveal that chromatin is partitioned into distinct "compartments" - contiguous stretches of chromatin on the order of megabases in size whose epigenetic modifications and associated protein factors cause them to be positioned close to similarly-modified compartments in three-dimensional space within the nucleus. In this post, we will take a look at one line of approaches for computationally identifying compartments in Hi-C datasets - one that uses the trans contact profile for each locus in the genome as a feature vector.

Open In Colab

Read more…

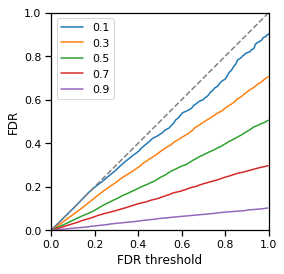
Optimal BH-FDR control

Controlling for false discovery rate (FDR) has become a ubiquitous step in statistical analyses that test multiple hypotheses, like those commonly performed in the genomics field. The seminal method for controlling FDR, the Benjamini-Hochberg (BH-FDR) procedure guarantees FDR control under some simple assumptions, but how does it really perform in the limit of an ideal dataset and ideal statistical test? In this post, we'll dive into this question and reveal that the proportion of truly non-null data points has a major influence on the behavior of BH-FDR.

Open In Colab

Read more…

Dota 2 friend network visualization

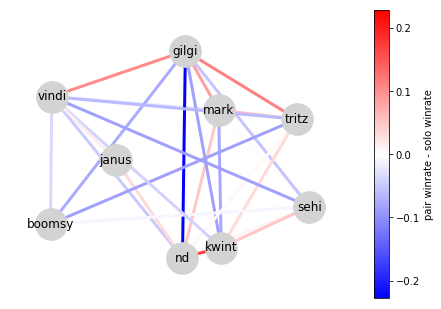
What better way is there to enjoy games than with friends? Of course, some friends have better synergies than others. What if there was a way to quantify those synergies and draw a group of friends as a graph, with high-synergy friends placed close together and low-synergy friends placed further apart?

In this post, we'll use the OpenDota API, multidimensional scaling (MDS), and networkx to visualize a network of friends playing Dota 2 together.

Open In Colab

Read more…

Estimation variance of the Poisson rate parameter

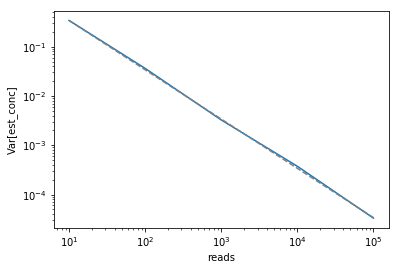
Many applications of statistics to genomics involve modelling read counts from high-throughput sequencing experiments as originating from a Poisson process (or as something similar based on the closely-related negative binomial distribution). In these experiments, we often want to estimate the true concentration $\mu$ of a particular DNA or RNA sequence in a sequencing library. This corresponds to the "rate" parameter of a Poison process, while the total number of reads sequenced can be thought of as related to its "elapsed time". How does the sequencing depth of the dataset (the total number of reads) impact the variance in the estimate of the true concentration? Read on to find out!

Open In Colab

Read more…

Visualizing trajectories of Dota Auto Chess games using LDA and TSNE

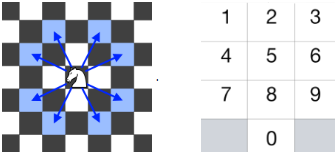
The Dota 2 custom map "Dota Auto Chess" is taking the gaming world by storm. Auto Chess is almost like a card game in which players attempt to improve their hand round after round while their "chesses" (cards) battle the other players in the game automatically. In this post, we'll explore the potential of latent Dirichlet allocation to model strategies (specific combinations of cards that are often played together) as "topics". We will then try to visualize the evolution of Auto Chess "hands" over the course of individual games in terms of their topics using t-SNE. These kinds of visualizations might help us learn how to more effectively evolve our strategies.

Open In Colab

Read more…

MLE estimation of mean parameter for scaled distributions

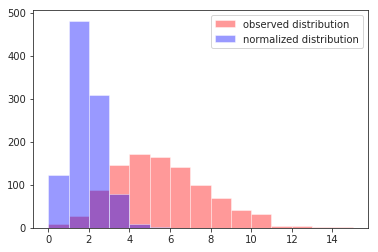
It's pretty common to run into statistical models that fit some kind of normalization factors that can be used to scale different data points to a common, comparable scale. When this happens to a location-scale family distribution like the normal distribution, estimating the mean parameter of such a scaled distribution is pretty straightforward. In many genomics contexts, however, non-location-scale distributions such as the Poisson or negative binomial (NB) distribution are used quite often. For example, it's common to model RNA-seq read counts using NB distributions scaled by the library size (i.e., some measure of the total sequencing depth). In this post, we'll take a deep dive into how to estimate the parameters of these "scaled" statistical models.

Open In Colab

Read more…

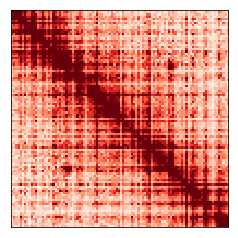
Simulating maps of 3D genome architecture

My research focuses on analyzing maps of the 3D structure of the genome. One of the things I always find helpful when trying to understand complex data like this is trying to simulate it myself to get a sense for how the data might behave. In this post, we'll add complexity step-by-step and work our way up to simulating realistic-looking genome folding maps from scratch!

Open In Colab

Read more…