MyAnimeList hype visualization with D3.js
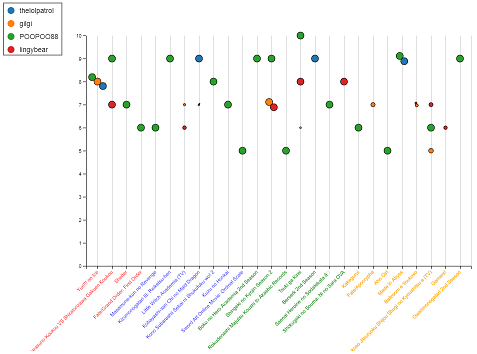
Everyone loves watching anime, but when there are so many shows airing it can be hard to keep track of what to watch and who's watching what. In this post, we'll use data from MyAnimeList to drive a custom D3.js visualization showing the ratings and number of episodes watched for all our friends.
![]()
Update: the mechanism this notebook uses to get data from MyAnimeList is out of date - stay tuned for a new-and-improved version of this visualization which will be based on the new Jikan API.
import xml.etree.ElementTree as ET
import pandas as pd
import requests
from datetime import datetime
import math
We will start off by specifying some date ranges that correspond to the four traditional yearly seasons of the anime calendar. We'll also list the MyAnimeList usernames of our friends:
date = lambda x: datetime.strptime(x, '%Y-%m-%d')
season_strings = ['2016-10-01', '2017-01-01', '2017-04-01', '2017-07-01', '2017-10-01']
season_dates = map(date, season_strings)
season_labels = ['Fall 2016', 'Winter 2017', 'Spring 2017', 'Summer 2017']
users = ['thelolpatrol', 'gilgi', 'POOPOO88', 'lingybear']
We'll be getting data out of MyAnimeList in an XML format from the https://myanimelist.net/malappinfo.php URL, which will allow us to get anime data for each of our friends. Here are a couple of functions which can help us get the XML data into a convenient Pandas DataFrame:
def xml2df(xml_data, tags=('anime',), columns=('series_animedb_id', 'series_title', 'my_score', 'my_watched_episodes', 'series_episodes', 'series_start'), types=(int, unicode, int, int, int, date)):
    root = ET.XML(xml_data)
    all_records = []
    for i, child in enumerate(root):
        if child.tag not in tags:
            continue
        record = {}
        for subchild in child:
            if subchild.tag in columns:
                cast_fn = types[columns.index(subchild.tag)]
                try:
                    record[subchild.tag] = cast_fn(subchild.text)
                except (TypeError, ValueError) as e:
                    print 'failed to decode', subchild.tag, subchild.text, e
        all_records.append(record)
    return pd.DataFrame(all_records)
def make_df(user):
    df = xml2df(requests.get('https://myanimelist.net/malappinfo.php?u=%s&status=all&type=anime' % user).text.encode('utf-8'))
    df['season'] = pd.cut(df.series_start, bins=season_dates, right=False, labels=season_labels)
    df.dropna(inplace=True)
    df = df.loc[~(df['my_score'] == 0)]
    #df.set_index('series_animedb_id', inplace=True)
    df.rename(columns={'my_score': 'score_%s' % user, 'my_watched_episodes': 'watched_episodes_%s' % user}, inplace=True)
    return df
dfs = map(make_df, users)
Next up, we'll merge together the DataFrames for each user into one big DataFrame that we'll use to feed our visualization:
joined = reduce(lambda x, y: x.merge(y, how='outer', on=['series_animedb_id', 'series_title', 'series_episodes', 'series_start', 'season']), dfs)
joined.sort_values('series_start', inplace=True)
titles = map(lambda x: x.encode('utf-8'), joined.series_title)
seasons = map(str, joined.season)
ids = map(int, joined.series_animedb_id)
data = []
for row in joined.itertuples():
    for user in users:
        if not math.isnan(getattr(row, 'watched_episodes_%s' % user)):
            data.append({'title': getattr(row, 'series_title').encode('utf-8'), 'score': getattr(row, 'score_%s' % user), 'watched': 7 * getattr(row, 'watched_episodes_%s' % user) / float(getattr(row, 'series_episodes')), 'user': user, 'id': getattr(row, 'series_animedb_id')})
Finally, here's the D3.js implementation of the anime visualization.
Most of this is pretty standard D3.js, but there are a few interesting things of note below:
- We'll use d3-tip to get nice tooltips for our visualization.
- We will inject the data from our DataFrame directly into the
<script>tag usingstring.Template. For a real web app we'd probably have our JS code request the data from some external source, but this will work for now. We can embed the HTML for the final, data-containing visualization by saving the value ofhtml_str, the string that results from injecting our data into the Template. - We'll use
d3.forceSimulation()to prevent the markers (representing different friends) from overlapping.
from IPython.core.display import HTML
from string import Template
template = Template('''
<svg width="960" height="700"></svg>

<script src="https://d3js.org/d3.v4.min.js"></script>
<script src="https://cdnjs.cloudflare.com/ajax/libs/d3-legend/2.24.0/d3-legend.min.js"></script>
<script src="https://cdnjs.cloudflare.com/ajax/libs/d3-tip/0.8.0-alpha.1/d3-tip.min.js"></script>
<link rel="stylesheet" href="https://rawgithub.com/Caged/d3-tip/master/examples/example-styles.css">
<script>
var titles = $titles;
var seasons = $seasons;
var ids = $ids;
var users = $users;
var data = $data;

var season_colors = {
  'Fall 2016': 'red',
  'Winter 2017': 'blue',
  'Spring 2017': 'green',
  'Summer 2017': 'orange'
};

var svg = d3.select("svg"),
    margin = {top: 70, right: 20, bottom: 170, left: 170},
    width = +svg.attr("width") - margin.left - margin.right,
    height = +svg.attr("height") - margin.top - margin.bottom;

var x = d3.scalePoint().rangeRound([0, width]).padding(0.5).domain(titles),
    y = d3.scaleLinear().rangeRound([height, 0]).domain([0, 10]),
    c = d3.scaleOrdinal(d3.schemeCategory10).domain(users);

data.forEach(function(d) {
    d['x'] = x(d.title);
    d['y'] = y(d.score);
});

var tip = d3.tip()
    .attr("class", "d3-tip")
    .attr("background", "white")
    .html(function(d) {
        return "<p>" + d.title + "</p><p>Rated " + d.score + "/10 by "+ d.user + "</p>";
    });
    svg.call(tip);

var g = svg.append("g")
    .attr("transform", "translate(" + margin.left + "," + margin.top + ")");

g.append("g")
    .attr("class", "axis axis-x")
    .attr("transform", "translate(0," + height + ")")
    .call(d3.axisBottom(x))
  .selectAll("text")
    .style("text-anchor", "end")
    .attr("dx", "-.8em")
    .attr("dy", ".15em")
    .attr("transform", "rotate(-45)")
    .attr("fill", function(d, i) { return season_colors[seasons[i]] })
    .on('dblclick', function(d, i) { return window.open('https://myanimelist.net/anime/' + ids[i], '_blank'); });

g.append("g")
    .attr("class", "axis axis-y")
    .call(d3.axisLeft(y).ticks(10));

function make_x_gridlines() {
    return d3.axisBottom(x)
        .ticks()
}

function make_y_gridlines() {
    return d3.axisLeft(y)
        .ticks()
}

g.append("g")
    .attr("class", "grid")
    .attr("transform", "translate(0," + height + ")")
    .attr("stroke-opacity", 0.2)
    .call(make_x_gridlines()
        .tickSize(-height)
        .tickFormat("")
    )

dots = g.selectAll(".dot")
  .data(data)
  .enter().append("circle")
    .attr("class", "dot")
    .attr("cx", function(d) { return d.x; })
    .attr("cy", function(d) { return d.y; })
    .attr("r", function(d) { return d.watched })
    .attr("fill", function(d) {return c(d.user) })
    .attr("stroke", "black")
    .on('dblclick', function(d) { return window.open('https://myanimelist.net/anime/' + d.id, '_blank'); })
    .on('mouseover', tip.show)
    .on('mouseout', tip.hide);

var simulation = d3.forceSimulation(data)
    .velocityDecay(0.9)
    .force("collide", d3.forceCollide().radius(function(d) { return d.watched; }).iterations(2))
    .on("tick", function() { dots.attr("cx", function(d) { return d.x; }).attr("cy", function(d) { return d.y; }) });

// set up legend
// step 1: create a group for all legend-related elements
var legendGroup = svg.append("g")
    .attr("class", "legendOrdinal")
    .attr("transform", "translate(20,20)");
// step 2: first thing (lowest in z-order) to add is a rectangle to outline the legend with
// we will fill in its size later
var legendBox = legendGroup.append("rect")
    .attr("class", "legend-box")
    .attr("fill", "white")
    .attr("stroke", "black");
// step 3: invoke d3-legend to create the legend
var legendOrdinal = d3.legendColor()
    .shape("path", d3.symbol().type(d3.symbolCircle).size(150)())
    .shapePadding(10)
    .scale(c);
var legend = svg.select(".legendOrdinal")
    .call(legendOrdinal);
// step 4: select the legend cells - we will do something with them
var legendCells = legendGroup.selectAll('.cell');
// step 4b: figure out what size to make the legendBox by iterating over the legendCells
var maxWidth = 0;
var totalHeight = 0;
legendCells.each(function(d) {
    var bbox = d3.select(this).node().getBBox();
    maxWidth = bbox.width > maxWidth ? bbox.width : maxWidth;
    totalHeight += bbox.height + 10;
});
legendBox.attr("width", maxWidth + 15)
    .attr("height", totalHeight)
    .attr("transform", "translate(-15,-15)");
</script>
''')
html_str = template.substitute({'titles': titles, 'data': data, 'seasons': seasons, 'ids': ids, 'users': users})
HTML(html_str)
Comments
Comments powered by Disqus